
featureCounts or htseq-count?
Count-based differential expression analysis of sequencing data is one of the best known pipeline in bioinformatics analysis. In this pipeline, the vital step is to estimate the reads count of each genomic features. After counting the features, the differential expression(DE) analysis tools are used for getting the differential expression list of genomic features. It has been widely used in CHIP-Seq and RNA-Seq. So far a couple of software(e.g. summarizeOverlaps, coverageBED, htseq-count and featureCounts) are provided for counting the features.
In the case of RNA-Seq, the features are typically genes, where each gene is considered here as the union of all its exons. Counting RNA-seq reads is complex because of the need to accommodate exon splicing. The common approach is to summarize counts at the gene level, by counting all reads that overlap any exon for each gene. In this method, gene annotation file from RefSeq or Ensembl is often used for this purpose. So far there are two major feature counting tools: featureCounts (Liao et al.) and htseq-count (Anders et al.). Both are very well known and reliable. But which one is better? I will provide my personally suggestion as follows.
Here I firstly summarize some common features of these two software.
1.Input files: both require for reference -based alignment files (BAM/SAM files) , both could be used for stranded/unstranded reads.
2.Genomic features file: both require for GTF/GFF file from RefSeq or Ensembl.
3. OS: both could be applied in UNIX.
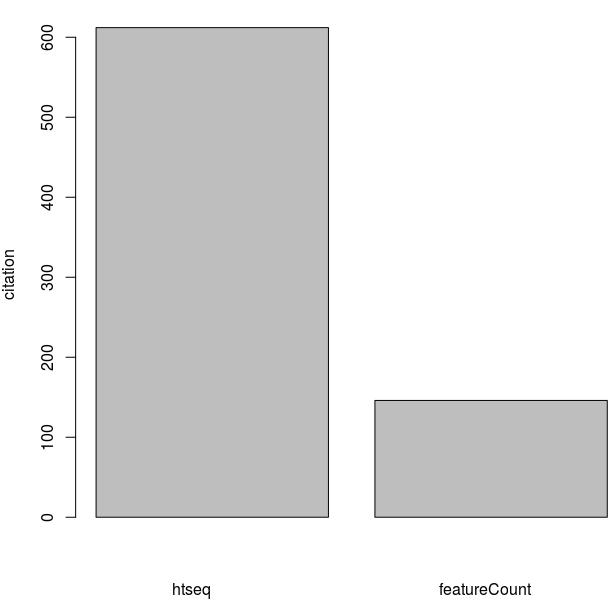
However, htseq-count has its own advantage. This Python based software is developed by the scientists from European Molecular Biology Laboratory, who also took part in the development of many well -known differential expression tools (e.g. DESeq, DESeq2) across RNA-Seq analysis. Hence, it seems more reliable and compatible to count-based differential expression RNA-Seq analysis. It’s worth to mention that the citation of htseq-count is favourable, lots of users are still use htseq.
In contrast, featureCounts has its own advantages:
1. Input files: The input of featureCounts could be SAF files rather than GTF/GFF files.
2.SAF files is 5 columns and more easier than GTF/GFF files.
GeneID Chr Start End Strand
301026 chr1 2206566 2209048 –
301026 chr1 2431765 2431992 –
301026 chr1 2661153 2662007 –
3.I have tested the running speed of featureCounts on my real data, which is ~20 times quicker than htseq-count .
4.Besides UNIX version, it also has R-based version. For the bioinformatian who liked to perform RNA-Seq or CHIP-Seq analysis in Windows/MacOS, featureCounts is the best choice.
5.featureCounts is more liberal than htseq-count, it could get more counts especially for pair-ended reads.
To observe it, let’s firstly check how htseq-count do the counting (the figure is taken from htseq manual).
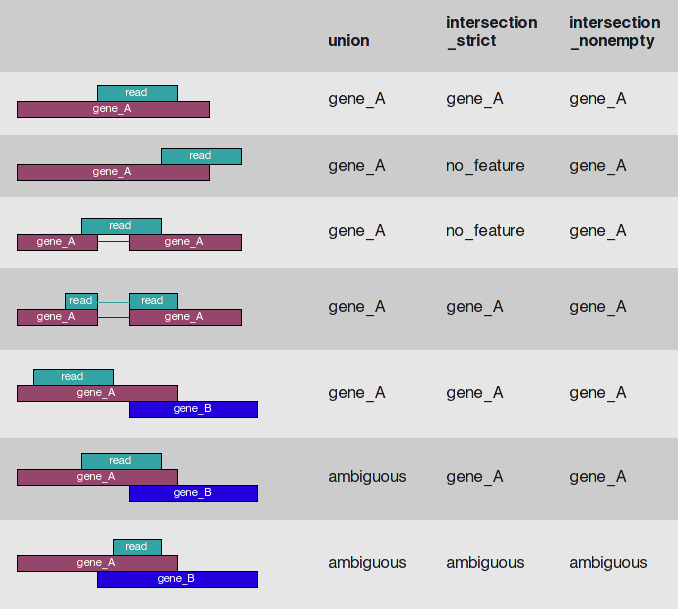
In the setting of htseq, union mode is the most appropriate and best recommended by the authors. If the reads(or read pair) contains more than one feature, the read (or read pair) is counted as ambiguous and not counted for any features. But featureCounts is different. For the single-ended reads, featureCounts and htseq-count are almost equivalent. But on pair-ended reads, featureCounts is advanced.
For example, if two genes were found to both overlap with a reads pair fragment but one gene was found to overlap with only one read and the other with both reads from that fragment, featureCounts will assign that fragment to the gene overlapping with both reads. However, htseq-count will take this fragment as ambiguous and will not assign it to any gene.
In my opinion, featureCounts can make a clear distinction for those features that overlap with different numbers of reads from the same fragment, meanwhile I think htseq-count is too conservative and get lower counts.
However, as the proportion of ‘ambiguous’ reads is very low. I have checked 20 real samples in my database, which is around 1000-100000 reads per sample, less than 0.5%. Hence, in summary, the controversial between two tools could be ignored in real data analysis. However, if the proportion of features overlap is high, you need to make the choice.
There’s also a strange bug in htseq-count (still not fixed at the time of writing) that causes a ‘buffer size exceeded’ error part-way through a run: http://seqanswers.com/forums/showthread.php?t=41531. Various potential fixes, but none absolutely guaranteed to work. I stopped using it for this reason (after successfully running it dozens of times it just failed on one of my bam files).